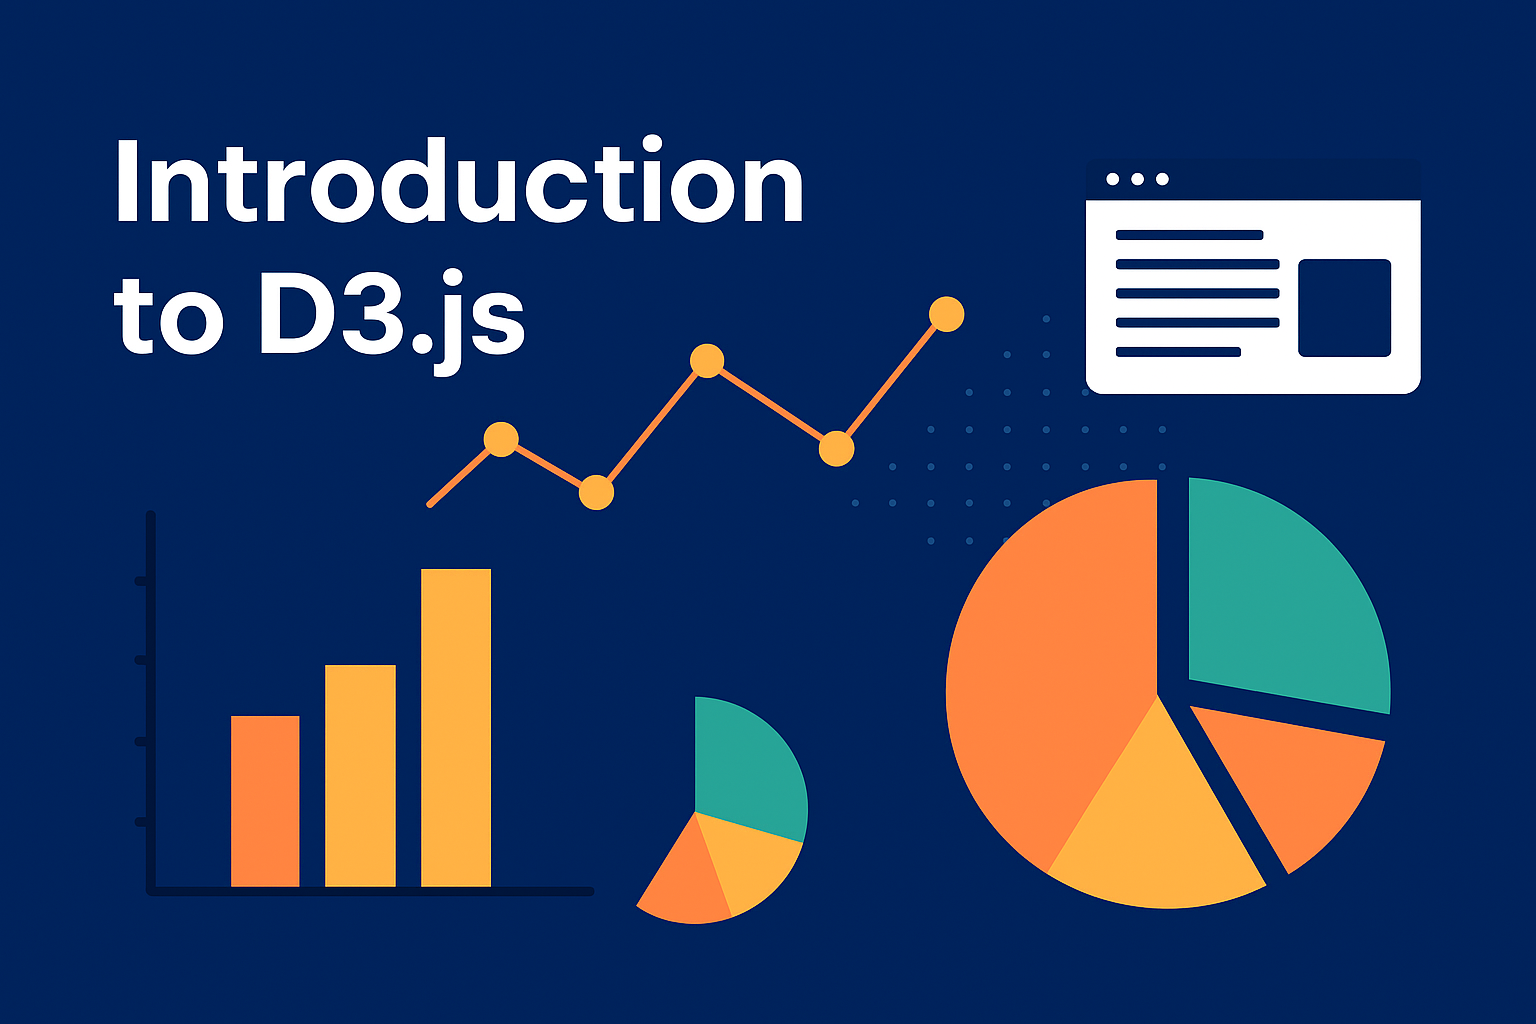
Data Visualization using D3.js
In our current data-saturated culture, the ability to visualize information is essential for making decisions and telling stories and analyzing. Though there are many libraries available, D3.js (Data-Driven Documents) is the most powerful and flexible way to create interactive and dynamic data visualizations on the web.
In this blog, we’ll cover what D3.js is, why it’s so popular, the core concepts, and how to get started.
D3.js is an open source JavaScript library by Mike Bostock. It allows developers to bind data to DOM elements, and then transform them, to create interactive dynamic data driven visualizations.
Whereas charting libraries provide you with pre-built charts (e.g. bar charts, line charts) and D3.js provides low-level building blocks so you may construct custom visualizations that accurately suit your requirements.
Why Use D3.js?
Here’s why D3.js is widely used:
- Flexibility: Build virtually any type of visualization.
- Interactivity: Add tooltips, transitions, zooming, or animations.
- Data Binding: Seamlessly link data with DOM elements.
- Scalability: Handle large datasets efficiently.
- Web Standards: Uses SVG, HTML5, and CSS, ensuring cross-browser compatibility.
Core Concepts in D3.js
To get the most out of D3.js, you should understand its key concepts:
1. Selections
Selections allow you to pick DOM elements and bind data to them.
d3.select("body").append("p").text("Hello, D3.js!");2. Data Binding
You can bind data to elements and manipulate them based on the dataset.
3. Scales
Scales map data values to visual properties (e.g., pixels, colors).
4. Axes
D3 provides utilities for drawing axes easily.
5. Transitions
Add animations to make your visualizations more engaging.
d3.select("circle")
  .transition()
  .duration(2000)
  .attr("r", 50);
Example: Simple Bar Chart in D3.js
Here’s a minimal example of a bar chart:
<!DOCTYPE html>
<meta charset="utf-8">

<!-- Load d3.js -->
<script src="https://d3js.org/d3.v4.js"></script>

<!-- Create a div where the graph will take place -->
<div id="my_dataviz"></div>

<script>
// set the dimensions and margins of the graph
var margin = {top: 30, right: 30, bottom: 70, left: 60},
    width = 460 - margin.left - margin.right,
    height = 400 - margin.top - margin.bottom;

// append the svg object to the body of the page
var svg = d3.select("#my_dataviz")
  .append("svg")
    .attr("width", width + margin.left + margin.right)
    .attr("height", height + margin.top + margin.bottom)
  .append("g")
    .attr("transform",
          "translate(" + margin.left + "," + margin.top + ")");

// Parse the Data
d3.csv("https://raw.githubusercontent.com/holtzy/data_to_viz/master/Example_dataset/7_OneCatOneNum_header.csv", function(data) {

// X axis
var x = d3.scaleBand()
  .range([ 0, width ])
  .domain(data.map(function(d) { return d.Country; }))
  .padding(0.2);
svg.append("g")
  .attr("transform", "translate(0," + height + ")")
  .call(d3.axisBottom(x))
  .selectAll("text")
    .attr("transform", "translate(-10,0)rotate(-45)")
    .style("text-anchor", "end");

// Add Y axis
var y = d3.scaleLinear()
  .domain([0, 13000])
  .range([ height, 0]);
svg.append("g")
  .call(d3.axisLeft(y));

// Bars
svg.selectAll("mybar")
  .data(data)
  .enter()
  .append("rect")
    .attr("x", function(d) { return x(d.Country); })
    .attr("y", function(d) { return y(d.Value); })
    .attr("width", x.bandwidth())
    .attr("height", function(d) { return height - y(d.Value); })
    .attr("fill", "#69b3a2")

})
</script>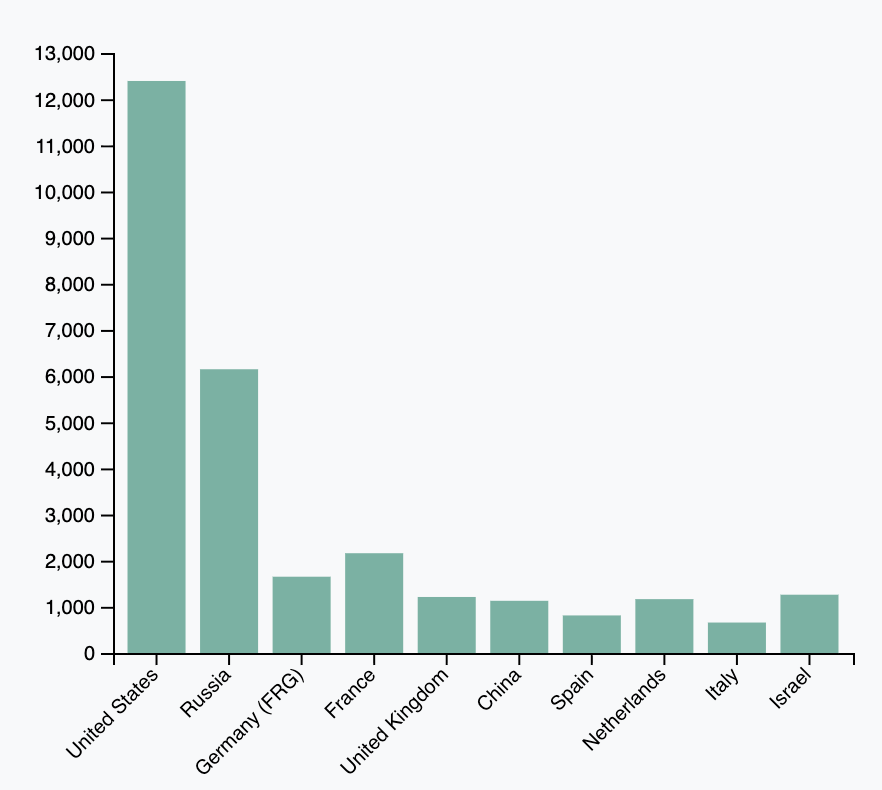
Pros and Cons of D3.js
Pros:
Unlimited customization
High performance with large datasets
Active community and resources
Cons:
Steeper learning curve compared to charting libraries (e.g., Chart.js, Highcharts)
Requires knowledge of SVG, HTML, and CSS
When to Use D3.js
Use D3.js when you need:
Custom, interactive visualizations
Data dashboards
Animated transitions
Advanced visual storytelling
D3.js is truly a game-changer for developers looking to have full control over their data visualizations. Sure, the learning curve can be a bit steep, but the payoff is incredible—think interactive, dynamic, and powerful visuals that really make your data pop.
Whether you're crafting dashboards, reports, or data-driven narratives, getting the hang of D3.js will elevate your skills to a whole new level.